Multiple Choice
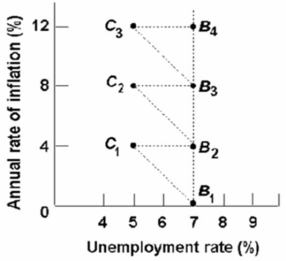 Refer to the above diagram and assume the economy is initially at point b1.According to the adaptive expectations theorists, the long-run relationship between the unemployment rate and the rate of inflation is represented by:
A) the line connecting B1 and C1.
B) the line through B1, B2, B3, and B4.
C) the line connecting C1 and B2.
D) any line parallel to the horizontal axis.
Correct Answer:

Verified
Correct Answer:
Verified
Q72: <img src="https://d2lvgg3v3hfg70.cloudfront.net/TB6686/.jpg" alt=" Refer to the
Q73: <img src="https://d2lvgg3v3hfg70.cloudfront.net/TB6686/.jpg" alt=" Refer to the
Q74: Demand-pull inflation and cost-push inflation are identical
Q75: Which of the following most significantly contributed
Q76: In terms of aggregate supply, the short
Q78: <img src="https://d2lvgg3v3hfg70.cloudfront.net/TB6686/.jpg" alt=" Refer to the
Q79: Refer to the graph below.The effects of
Q80: <img src="https://d2lvgg3v3hfg70.cloudfront.net/TB6686/.jpg" alt=" Refer to the
Q81: Based on the long-run Phillips Curve, any
Q82: In terms of aggregate supply, the difference