Multiple Choice
Refer to the graph below.The effects of stagflation, in the short run, are best represented by a shift from: 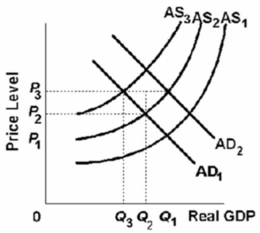
A) AD1 to AD2 given a stable AS1curve, an increase in the price level from P1to P2, and a fall in output from Q1 to Q2.
B) AD2 to AD1 given a stable AS1 curve, an increase in the price level from P1 to P2, and a fall in output from Q1 to Q2.
C) AS1 to AS2 given a stable AD1 curve, an increase in the price level from P1 to P2, and a fall in output from Q1 to Q2.
D) AS2 to AS1 given a stable AD1 curve, an increase in the price level from P1 to P2, and a fall in output from Q1 to Q2.
Correct Answer:

Verified
Correct Answer:
Verified
Q74: Demand-pull inflation and cost-push inflation are identical
Q75: Which of the following most significantly contributed
Q76: In terms of aggregate supply, the short
Q77: <img src="https://d2lvgg3v3hfg70.cloudfront.net/TB6686/.jpg" alt=" Refer to the
Q78: <img src="https://d2lvgg3v3hfg70.cloudfront.net/TB6686/.jpg" alt=" Refer to the
Q80: <img src="https://d2lvgg3v3hfg70.cloudfront.net/TB6686/.jpg" alt=" Refer to the
Q81: Based on the long-run Phillips Curve, any
Q82: In terms of aggregate supply, the difference
Q83: <img src="https://d2lvgg3v3hfg70.cloudfront.net/TB6686/.jpg" alt=" Refer to the
Q84: If the government attempts to maintain full