Multiple Choice
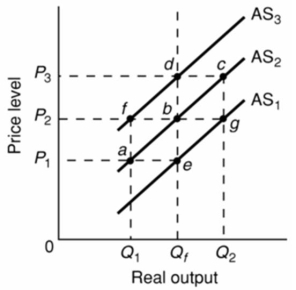 Refer to the above diagram.Assume that nominal wages initially are set on the basis of the price level P2 and that the economy initially is operating at its full-employment level of output Qf.In terms of this diagram, the long-run aggregate supply curve:
A) is AS2.
B) is a vertical line extending from Qf upward through e, b, and d.
C) may be either AS1, AS2, or AS3 depending on whether the price level is P1, P2, or P3.
D) is a horizontal line extending from P2 rightward through f, b, and g.
Correct Answer:

Verified
Correct Answer:
Verified
Q73: <img src="https://d2lvgg3v3hfg70.cloudfront.net/TB6686/.jpg" alt=" Refer to the
Q74: Demand-pull inflation and cost-push inflation are identical
Q75: Which of the following most significantly contributed
Q76: In terms of aggregate supply, the short
Q77: <img src="https://d2lvgg3v3hfg70.cloudfront.net/TB6686/.jpg" alt=" Refer to the
Q79: Refer to the graph below.The effects of
Q80: <img src="https://d2lvgg3v3hfg70.cloudfront.net/TB6686/.jpg" alt=" Refer to the
Q81: Based on the long-run Phillips Curve, any
Q82: In terms of aggregate supply, the difference
Q83: <img src="https://d2lvgg3v3hfg70.cloudfront.net/TB6686/.jpg" alt=" Refer to the