Multiple Choice
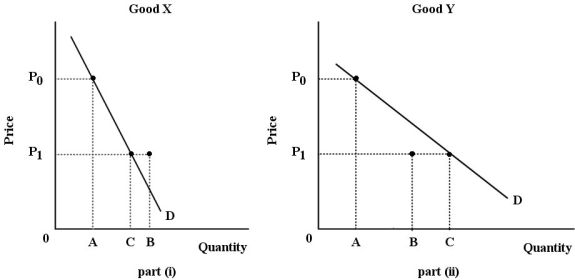 FIGURE 6- 3
-Refer to Figure 6- 3. For both goods, the price falls from P0 to P1. The substitution effect is illustrated by the change in quantity demanded from A to B; the income effect is illustrated by the change in quantity demanded from B to C. Good X is certainly a(n) good.
A) luxury
B) normal
C) Giffen
D) inferior
E) necessity
Correct Answer:

Verified
Correct Answer:
Verified
Q1: <img src="https://d2lvgg3v3hfg70.cloudfront.net/TB5438/.jpg" alt=" FIGURE 6- 10
Q4: <span class="ql-formula" data-value="\quad\quad\quad\quad\quad\quad\quad\quad\quad\quad\quad\text { Toffee (bars) }"><span
Q5: Marginal utility theory is about<br>A) proving that
Q6: <img src="https://d2lvgg3v3hfg70.cloudfront.net/TB5438/.jpg" alt=" FIGURE 6- 8
Q7: The marginal rate of substitution measures the
Q8: Suppose a consumer can purchase only two
Q9: An individual's consumer surplus from some product
Q10: The Smith family is allocating its monthly
Q11: Marginal utility analysis predicts a downward- sloping
Q119: The table below shows the quantities of