Multiple Choice
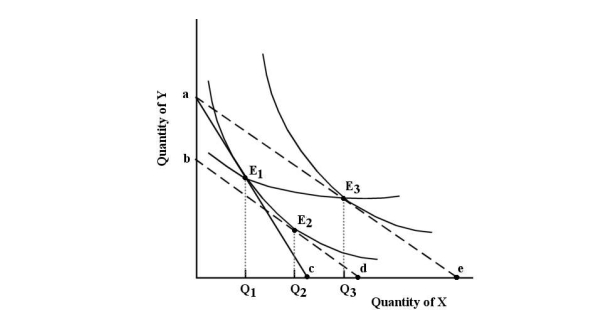 FIGURE 6- 10
-Refer to Figure 6- 10. Suppose the consumer begins at E1. The income and substitution effects of the reduction in the price of X are represented as follows:
A) the distance Q1Q2 shows the income effect and the distance Q2Q3 shows the substitution effect.
B) the distance Q1Q2 shows the substitution effect and the distance Q2Q3 shows the income effect.
C) the distance Q1d shows the substitution effect and the distance Q2e shows the income effect.
D) the distance de shows the income effect and the distance cd shows the substitution effect.
E) the distance Q1Q3 shows the substitution effect and the distance Q2Q3 shows the income effect.
Correct Answer:

Verified
Correct Answer:
Verified
Q2: <img src="https://d2lvgg3v3hfg70.cloudfront.net/TB5438/.jpg" alt=" FIGURE 6- 3
Q4: <span class="ql-formula" data-value="\quad\quad\quad\quad\quad\quad\quad\quad\quad\quad\quad\text { Toffee (bars) }"><span
Q5: Marginal utility theory is about<br>A) proving that
Q6: <img src="https://d2lvgg3v3hfg70.cloudfront.net/TB5438/.jpg" alt=" FIGURE 6- 8
Q7: The marginal rate of substitution measures the
Q8: Suppose a consumer can purchase only two
Q9: An individual's consumer surplus from some product
Q10: The Smith family is allocating its monthly
Q11: Marginal utility analysis predicts a downward- sloping
Q119: The table below shows the quantities of