Multiple Choice
The diagram below shows the market for apartments in a city. Assume that all apartments are identical. 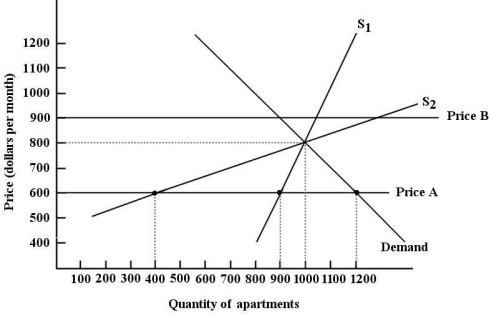 FIGURE 5- 4
-Refer to Figure 5- 4. Suppose the government imposes a rent- controlled price of $600 per month on apartments in this city. In the long run we can expect the shortage of apartments to be _ units.
A) 300
B) 800
C) 1000
D) 0
E) 200
Correct Answer:

Verified
Correct Answer:
Verified
Q61: Consider the market for any agricultural commodity
Q62: Consider the following demand and supply
Q63: In a competitive market, a legal price
Q64: A minimum permissible price established by the
Q65: The diagram below shows the market for
Q67: <span class="ql-formula" data-value="\text { Demand and Supply
Q68: <img src="https://d2lvgg3v3hfg70.cloudfront.net/TB5438/.jpg" alt=" FIGURE 5- 2
Q69: A binding price floor is a<br>A) minimum
Q70: The diagram below shows the market for
Q71: Suppose the government establishes a binding price