Multiple Choice
The diagram below shows the market for litres of milk. 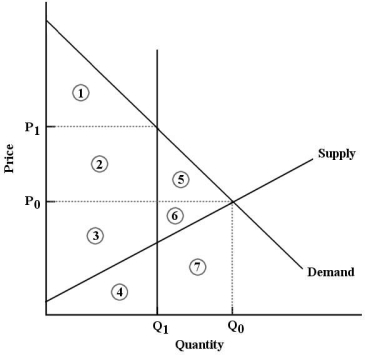 FIGURE 5- 8
-Refer to Figure 5- 8. After the imposition of a milk quota at quantity Q1, economic surplus is represented by
A) areas 3 and 4.
B) areas 1, 2 and 3.
C) areas 2, 3, 5 and 6.
D) areas 1, 2 and 5.
E) areas 1, 2, 3, 4, 5, 6 and 7.
Correct Answer:

Verified
Correct Answer:
Verified
Q65: The diagram below shows the market for
Q66: The diagram below shows the market for
Q67: <span class="ql-formula" data-value="\text { Demand and Supply
Q68: <img src="https://d2lvgg3v3hfg70.cloudfront.net/TB5438/.jpg" alt=" FIGURE 5- 2
Q69: A binding price floor is a<br>A) minimum
Q71: Suppose the government establishes a binding price
Q72: In a market where we observe a
Q73: The likely consequence of a binding minimum
Q74: If the government fixes the price of
Q75: Suppose that the free- market equilibrium price