Multiple Choice
The diagram below shows the market for litres of milk. 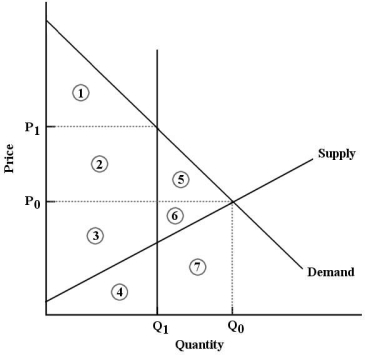 FIGURE 5- 8
-Refer to Figure 5- 8. Suppose that a binding output quota is imposed on this market at quantity Q1. The loss in economic surplus due to the quota is equal to
A) areas 5 and 6.
B) areas 2 and 5.
C) areas 5, 6 and 7.
D) areas 1, 2 and 3.
E) area 1.
Correct Answer:

Verified
Correct Answer:
Verified
Q60: Output quotas are commonly used in markets
Q61: Consider the market for any agricultural commodity
Q62: Consider the following demand and supply
Q63: In a competitive market, a legal price
Q64: A minimum permissible price established by the
Q66: The diagram below shows the market for
Q67: <span class="ql-formula" data-value="\text { Demand and Supply
Q68: <img src="https://d2lvgg3v3hfg70.cloudfront.net/TB5438/.jpg" alt=" FIGURE 5- 2
Q69: A binding price floor is a<br>A) minimum
Q70: The diagram below shows the market for