Multiple Choice
The diagram below shows two production possibilities boundaries for Country X. 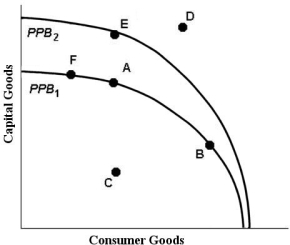 FIGURE 1- 3
-Refer to Figure 1- 3. At point B,
A) the opportunity cost of producing an extra unit of consumption goods is higher than at point A.
B) the price of capital goods is higher than the price of consumption goods.
C) the opportunity cost of producing an extra unit of capital goods is higher than at point A.
D) Country X is producing too many consumption goods and too few capital goods.
E) the price of consumption goods is equal to the price of capital goods.
Correct Answer:

Verified
Correct Answer:
Verified
Q30: Behaviour in free- market economies is<br>A)determined by
Q47: Economics can best be described as<br>A)the application
Q54: Which of the following statements best describes
Q66: One of the major results of the
Q69: Suppose there are three alternatives to attending
Q81: The table below shows that, in
Q82: The table below shows that, in
Q83: The diagram below shows two production possibilities
Q85: The table below illustrates that, in
Q88: The downward- sloping line in the diagram