Multiple Choice
The diagram below shows two production possibilities boundaries for Country X. 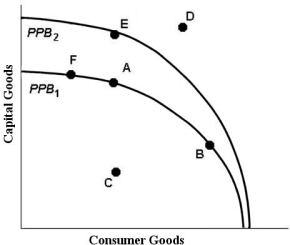 FIGURE 1- 3
-Refer to Figure 1- 3. That the production possibilities boundaries are drawn concave to the origin reflects the
A) unfair distribution of resources in the economy.
B) constant opportunity cost of producing more of either good.
C) decreasing opportunity cost of producing more of either good.
D) increasing opportunity cost of producing more of either good.
E) scarcity of resources in the economy.
Correct Answer:

Verified
Correct Answer:
Verified
Q6: During the nineteenth and early twentieth centuries,
Q30: Behaviour in free- market economies is<br>A)determined by
Q47: Economics can best be described as<br>A)the application
Q66: One of the major results of the
Q69: Suppose there are three alternatives to attending
Q81: The table below shows that, in
Q82: The table below shows that, in
Q84: The diagram below shows two production possibilities
Q85: The table below illustrates that, in
Q88: The downward- sloping line in the diagram