Multiple Choice
The downward- sloping line in the diagram below shows the combinations of health care and education expenditures that the government can afford with a given amount of tax revenue. 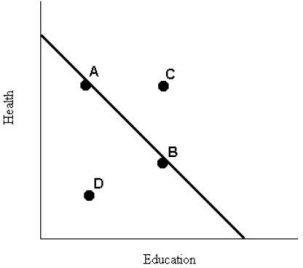 FIGURE 1- 5
-Refer to Figure 1- 5. The levels of health and education expenditures at point C
A) are equal to those of point A and point B.
B) are less than at point D.
C) could be achieved if the prices of health and/or education increased.
D) are more cost- effective than those at points A, B, and D.
E) are not attainable with the government's current budget.
Correct Answer:

Verified
Correct Answer:
Verified
Q16: Suppose a scientific breakthrough leads to a
Q30: Behaviour in free- market economies is<br>A)determined by
Q47: Economics can best be described as<br>A)the application
Q54: Which of the following statements best describes
Q56: In command economies, economic behaviour is<br>A)largely affected
Q70: In mixed economies, economic behaviour is<br>A)based primarily
Q73: In the current Canadian economy, the majority
Q83: The diagram below shows two production possibilities
Q84: The diagram below shows two production possibilities
Q85: The table below illustrates that, in