Multiple Choice
Refer to the graph shown. A firm planning to produce 1,500 units of output would choose the scale of operation represented by: 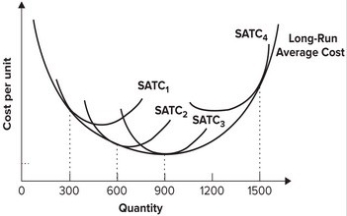
A) SATC1.
B) SATC2.
C) SATC3.
D) SATC4.
Correct Answer:

Verified
Correct Answer:
Verified
Related Questions
Q60: Which of the following is most likely
Q61: A firm finds that producing 30,000 vases
Q62: Refer to the graph shown. The marginal
Q63: Refer to the graph shown. The output
Q64: The production techniques available to real-world firms
Q66: Refer to the graph shown. A firm
Q67: Refer to the graph shown. If the
Q68: The relationship between long-run and short-run average
Q69: Which of the following provides the best
Q70: If the average total cost of supplying