Multiple Choice
Refer to the graph shown. A firm that shifts from SATC1 to SATC2 is most likely to do so because planned output increases: 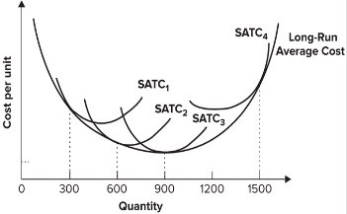
A) to 300.
B) from 300 to 900.
C) from 300 to 600.
D) from 600 to 900.
Correct Answer:

Verified
Correct Answer:
Verified
Related Questions
Q61: A firm finds that producing 30,000 vases
Q62: Refer to the graph shown. The marginal
Q63: Refer to the graph shown. The output
Q64: The production techniques available to real-world firms
Q65: Refer to the graph shown. A firm
Q67: Refer to the graph shown. If the
Q68: The relationship between long-run and short-run average
Q69: Which of the following provides the best
Q70: If the average total cost of supplying
Q71: Economies of scale are associated with:<br>A) indivisible