Multiple Choice
Refer to the following graph. 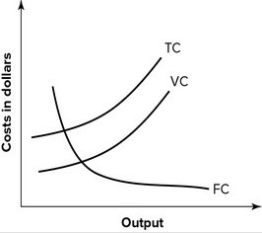 This set of cost curves is:
A) correct.
B) wrong because the total cost and variable cost curves are reversed.
C) wrong because the fixed cost curve is drawn incorrectly.
D) wrong because the total cost and variable cost curves are actually the average total cost and average variable cost curves.
Correct Answer:

Verified
Correct Answer:
Verified
Q1: When output is 20, fixed costs are
Q3: Refer to the graph shown. <img src="https://d2lvgg3v3hfg70.cloudfront.net/TB7145/.jpg"
Q4: Refer to the graph shown. Within which
Q5: Refer to the table shown. The
Q6: What kind of costs remain the same
Q7: Refer to the table shown. The
Q8: The vertical distance between the average total
Q9: The following graph shows average fixed costs,
Q10: Average variable cost is total variable cost:<br>A)
Q11: If the law of diminishing marginal productivity