menu-iconExamlexExamLexServices

Discover

Ask a Question
  1. All Topics
  2. Topic
    Business
  3. Study Set
    Microeconomics Study Set 30
  4. Exam
    Exam 6: Describing Supply and Demand: Elasticities
  5. Question
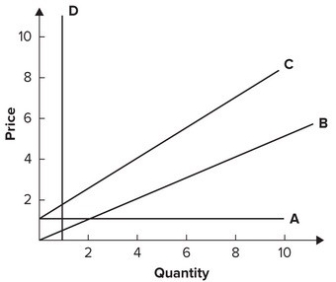
    Refer to the Graph Shown
Solved

Refer to the Graph Shown

Question 175

Question 175

Multiple Choice

Refer to the graph shown. For which curve does the price elasticity of supply decrease as price increases? Refer to the graph shown. For which curve does the price elasticity of supply decrease as price increases?   A)  A B)  B C)  C D)  D

A) A
B) B
C) C
D) D

Correct Answer:

verifed

Verified

Unlock this answer now
Get Access to more Verified Answers free of charge

Related Questions

Q166: When the price of a good increases,

Q167: Refer to the graph shown. The approximate

Q168: It is estimated that a 10 percent

Q169: Refer to the graph shown. When price

Q170: GreenTree Corporation sells live Christmas trees. It

Q171: Refer to the graph shown. When price

Q172: If the quantity of picture frames supplied

Q173: Refer to the graph shown. At which

Q174: If the quantity of Big Macs demanded

Q176: Refer to the graph shown. When price

Examlex

ExamLex

About UsContact UsPerks CenterHomeschoolingTest Prep

Work With Us

Campus RepresentativeInfluencers

Links

FaqPricingChrome Extension

Download The App

Get App StoreGet Google Play

Policies

Privacy PolicyTerms of ServiceHonor CodeCommunity Guidelines

Scan To Download

qr-code

Copyright © (2025) ExamLex LLC.

Privacy PolicyTerms Of ServiceHonor CodeCommunity Guidelines