Multiple Choice
Refer to the graph shown which shows total product. At point B: 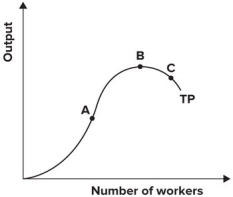
A) marginal product is at its minimum.
B) marginal product is at its maximum.
C) marginal product is zero.
D) average product is at its maximum.
Correct Answer:

Verified
Correct Answer:
Verified
Q33: Draw and correctly label a typical set
Q36: Refer to the table shown. The
Q40: Refer to the following graph. <img src="https://d2lvgg3v3hfg70.cloudfront.net/TB7143/.jpg"
Q42: Refer to the table shown. Marginal
Q43: Refer to the following graph. <img src="https://d2lvgg3v3hfg70.cloudfront.net/TB7143/.jpg"
Q44: Refer to the table shown. When
Q73: As output increases, average total cost always
Q91: If the average cost of producing 10
Q104: If total cost is 100, total fixed
Q116: Owen runs a delivery business and currently