Multiple Choice
Refer to the following graph. 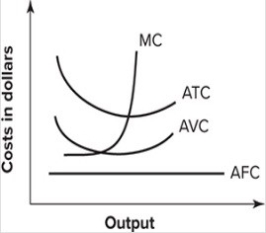 This set of cost curves is:
A) correct.
B) wrong because the average total cost and the marginal cost curves are reversed.
C) wrong because the average fixed cost curve is drawn incorrectly.
D) wrong because the average fixed cost curve is shown to be below the average variable cost.
Correct Answer:

Verified
Correct Answer:
Verified
Q33: Draw and correctly label a typical set
Q35: Refer to the graph shown. The line
Q36: Refer to the table shown. The
Q41: Refer to the graph shown which shows
Q42: Refer to the table shown. Marginal
Q43: Refer to the following graph. <img src="https://d2lvgg3v3hfg70.cloudfront.net/TB7143/.jpg"
Q44: Refer to the table shown. When
Q73: As output increases, average total cost always
Q91: If the average cost of producing 10
Q116: Owen runs a delivery business and currently