Multiple Choice
Refer to the following graph. 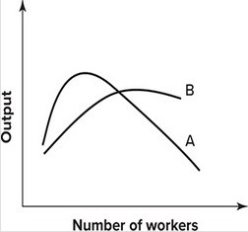 The marginal product and average product curves:
A) are A and B, respectively.
B) are B and A, respectively.
C) could be either A or B.
D) are not drawn properly.
Correct Answer:

Verified
Correct Answer:
Verified
Related Questions
Q33: Draw and correctly label a typical set
Q40: Refer to the following graph. <img src="https://d2lvgg3v3hfg70.cloudfront.net/TB7143/.jpg"
Q41: Refer to the graph shown which shows
Q42: Refer to the table shown. Marginal
Q44: Refer to the table shown. When
Q63: If marginal cost exceeds average total cost:<br>A)
Q73: As output increases, average total cost always
Q87: Costs that are spent and cannot be
Q104: If total cost is 100, total fixed
Q116: Owen runs a delivery business and currently