Multiple Choice
Refer to the graph shown. Calculate the approximate elasticity of demand for the line segment CD: 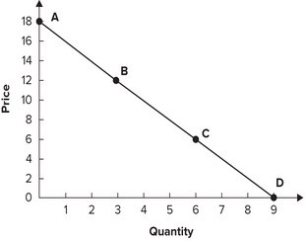
A) 3.
B) 1/3.
C) 1/5.
D) 5.
Correct Answer:

Verified
Correct Answer:
Verified
Related Questions
Q1: As the manager of a ski resort,
Q7: It is estimated that a 5 percent
Q25: Measuring the price of gasoline in dollars,
Q26: Define the price elasticity of supply.
Q63: If demand is highly inelastic and supply
Q72: Refer to the graph shown. Demand is
Q73: Refer to the following table to
Q74: Refer to the graph shown. Area C
Q76: Refer to the graph shown. When price
Q81: Refer to the table shown to