Multiple Choice
Refer to the graph shown. When price rises from $10 to $30: 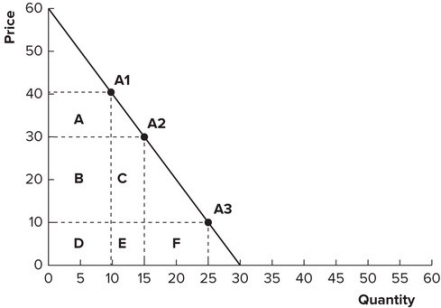
A) lost revenue is represented by areas B and C and gained revenue is represented by area F.
B) gained revenue is represented by areas B and C and lost revenue is represented by area F.
C) lost revenue is represented by areas B, C, and D and gained revenue is represented by area A.
D) gained revenue is represented by areas B, C, and D and lost revenue is represented by area A.
Correct Answer:

Verified
Correct Answer:
Verified
Q1: As the manager of a ski resort,
Q7: It is estimated that a 5 percent
Q26: Define the price elasticity of supply.
Q63: If demand is highly inelastic and supply
Q72: Refer to the graph shown. Demand is
Q73: Refer to the following table to
Q74: Refer to the graph shown. Area C
Q77: Refer to the graph shown. Calculate the
Q81: Refer to the table shown to
Q150: Revenue remains unchanged along a straight-line demand