Multiple Choice
Refer to the graph shown. Area C plus area E is: 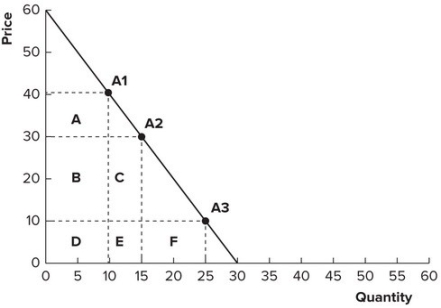
A) smaller than area A, because demand is elastic between $30 and $40.
B) larger than area A, because demand is inelastic between $30 and $40.
C) smaller than area A, because demand is inelastic between $30 and $40.
D) larger than area A, because demand is elastic between $30 and $40.
Correct Answer:

Verified
Correct Answer:
Verified
Q3: As the price of tomatoes fell from
Q7: It is estimated that a 5 percent
Q26: Define the price elasticity of supply.
Q63: If demand is highly inelastic and supply
Q69: Refer to the following table to
Q72: Refer to the graph shown. Demand is
Q73: Refer to the following table to
Q76: Refer to the graph shown. When price
Q77: Refer to the graph shown. Calculate the
Q150: Revenue remains unchanged along a straight-line demand