Multiple Choice
What can we say about the graph below? 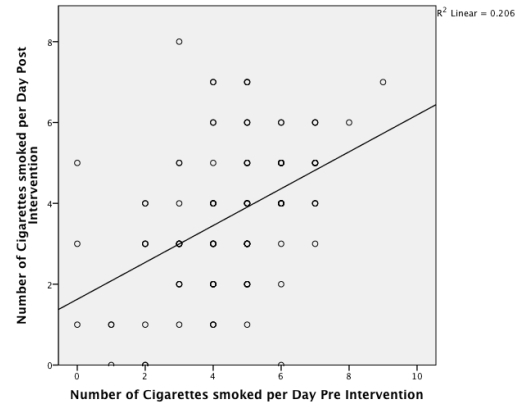
A) There is a negative relationship between the number of cigarettes smoked per day before the intervention and the number of cigarettes smoked after the intervention.
B) There is no relationship between the two variables
C) The participants who smoked the most cigarettes per day before the intervention,smoked the fewest cigarettes per day after the intervention.
D) There is a positive relationship between the number of cigarettes smoked per day before the intervention and the number of cigarettes smoked after the intervention..
Correct Answer:

Verified
Correct Answer:
Verified
Q1: Imagine we took a group of smokers,
Q6: Looking at the graph below,approximately what was
Q7: We took a sample of children who
Q8: What does the graph below show? <img
Q9: In IBM SPSS,what is this graph known
Q10: Approximately what is the median success score
Q12: Looking at the graph below,which intervention was
Q13: A study was done to investigate the
Q14: Based on the chart,what was the median
Q16: What is the graph below known as?