Multiple Choice
We took a sample of children who had been learning to play a musical instrument for five years.We measured the number of hours they spent practising each week and assessed their musical skill by how many of 8 increasingly difficult exams they had passed.We also asked them whether their parents forced them to practise or not (were their parents pushy?) .What does the following graph show? 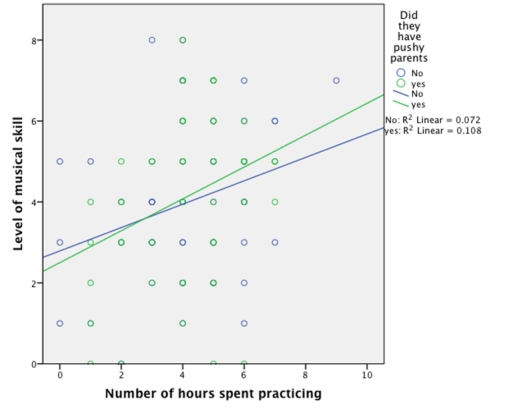
A) The more time spent practising,the more musically skilled the children were and this relationship was stronger for those who had pushy parents compared to those who did not.
B) The more time spent practising,the more musically skilled the children were,and this relationship was stronger for children who did not have pushy parents than for those who did.
C) Children with pushy parents always passed more grade exams than those without.
D) Practice causes better exam performance.
Correct Answer:

Verified
Correct Answer:
Verified
Q2: We took a sample of children who
Q3: Looking at the graph below,which of the
Q4: Approximately what is the mean success score
Q5: The graph below shows the mean success
Q6: Looking at the graph below,approximately what was
Q8: What does the graph below show? <img
Q9: In IBM SPSS,what is this graph known
Q10: Approximately what is the median success score
Q11: What can we say about the graph
Q12: Looking at the graph below,which intervention was