Multiple Choice
In IBM SPSS,what is this graph known as? 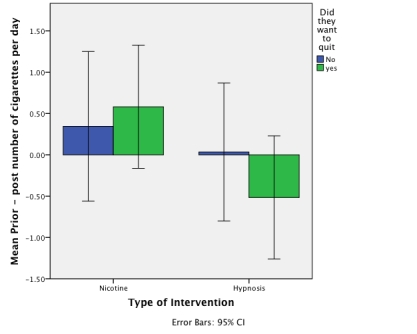
A) Simple bar chart
B) Clustered bar chart
C) A histogram
D) Frequency polygon
Correct Answer:

Verified
Correct Answer:
Verified
Related Questions
Q4: Approximately what is the mean success score
Q5: The graph below shows the mean success
Q6: Looking at the graph below,approximately what was
Q7: We took a sample of children who
Q8: What does the graph below show? <img
Q10: Approximately what is the median success score
Q11: What can we say about the graph
Q12: Looking at the graph below,which intervention was
Q13: A study was done to investigate the
Q14: Based on the chart,what was the median