Multiple Choice
Figure 12-17 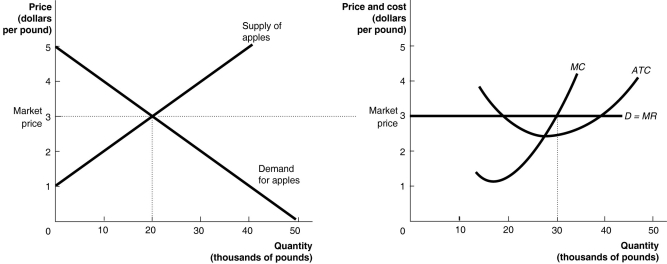 The graphs in Figure 12-17 represent the perfectly competitive market demand and supply curves for the apple industry and demand and cost curves for a typical firm in the industry.
-Refer to Figure 12-17. The graphs depicts a short-run equilibrium. How will this differ from the long-run equilibrium? (Assume this is a constant-cost industry.)
A) Fewer firms will be in the market in the long run than in the short run.
B) The price will be higher in the long run than in the short run.
C) The market supply curve will be further to the left in the long run than in the short run.
D) The firm's profit will be lower in the long run than in the short run.
Correct Answer:

Verified
Correct Answer:
Verified
Q87: A firm's total profit can be calculated
Q134: Figure 12-9 <img src="https://d2lvgg3v3hfg70.cloudfront.net/TB7397/.jpg" alt="Figure 12-9
Q141: If price is equal to average variable
Q164: Assume that a perfectly competitive market is
Q184: Figure 12-12<br> <img src="https://d2lvgg3v3hfg70.cloudfront.net/TB4193/.jpg" alt="Figure 12-12
Q235: The minimum point on the average variable
Q236: Figure 12-17<br> <img src="https://d2lvgg3v3hfg70.cloudfront.net/TB4193/.jpg" alt="Figure 12-17
Q241: A perfectly competitive industry achieves allocative efficiency
Q285: Profit is the difference between<br>A)marginal revenue and
Q295: Figure 12-5<br> <img src="https://d2lvgg3v3hfg70.cloudfront.net/TB4193/.jpg" alt="Figure 12-5