Multiple Choice
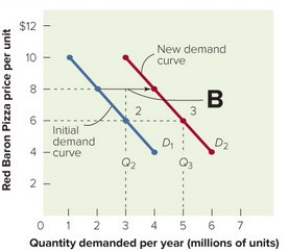 Figure 13-4B
-In Figure 13-4B above, the demand curve shifts from D2to D3(B) . This most likely represents
A) an increase in demand resulting from competitor or consumer changes.
B) an increase in demand that required a decrease in price.
C) no change in price and no change in demand.
D) no change in demand or price but a greater profit due to economies of scale.
E) a decrease in price from $8 to $6 per unit.
Correct Answer:

Verified
Correct Answer:
Verified
Q58: A company that manages apartments decides to
Q59: Demand for a product is likely to
Q60: The sum of the expenses of a
Q61: Which of the following are elements involved
Q62: Washburn Guitars markets its guitars to four
Q64: A primary reason for Washburn Guitars' success
Q65: Which of these is a typical example
Q66: What is the difference between fixed costs
Q67: Insurance premiums, entrance fees, train fares, and
Q68: All of these are legal or ethical