Essay
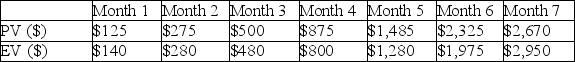
Use the information in the table regarding this seven-month project to create two plots. The first plot should be the S-curve for Earned Value. Indicate on this plot whether the project is ahead or behind schedule and by how much. The second plot should be the Earned Schedule and the Estimate at Completion for Time. Comment on the symmetry of this graph and whether you would expect a similar plot from any other project to exhibit similar characteristics.
Correct Answer:

Verified
The Earned Schedule table appears below....View Answer
Unlock this answer now
Get Access to more Verified Answers free of charge
Correct Answer:
Verified
View Answer
Unlock this answer now
Get Access to more Verified Answers free of charge
Q13: Use this earned schedule table to determine
Q15: Use the S-curve where the solid line
Q16: At the end of week 10, this
Q17: Use the data to calculate the schedule
Q19: Use the data to calculate the earned
Q38: The first step in earned value management
Q40: The project control cycle is continuous.
Q83: The budget variance is calculated as:<br>A)Earned value
Q90: <img src="https://d2lvgg3v3hfg70.cloudfront.net/TB6815/.jpg" alt=" -Use the S-curve
Q103: The classic project S-curve is a plot