Multiple Choice
The table shows the number of minutes ridden on a stationary bike and the approximate number of calories burned. Plot the points on the grid provided then choose the most likely correlation coefficient from the answer choices below. 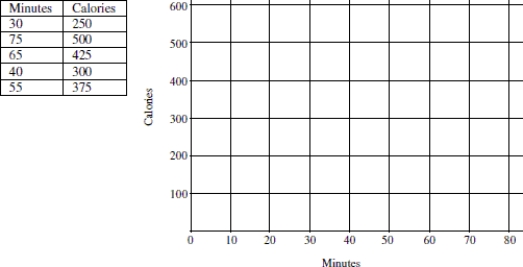
A) - 0.99
B) - 0.20
C) 0.20
D) 0.99
Correct Answer:

Verified
Correct Answer:
Verified
Q17: Use the data provided in the table
Q18: Use the following information to answer the
Q19: r = 0.8787<br>A) <img src="https://d2lvgg3v3hfg70.cloudfront.net/TB5647/.jpg" alt="r =
Q20: The scatterplot below shows the number of
Q21: The following model was created to show
Q23: State the explanatory variable and the response
Q24: A horticulturist conducted an experiment on 120
Q25: The data in the table represent the
Q26: The scatterplot below shows the hat size
Q27: The scatterplot below shows the number of