Multiple Choice
A group of junior high athletes was asked what team sport was their favorite. The data are summarized in the table below. On the pie chart, which area would correspond to the category "Volleyball"? 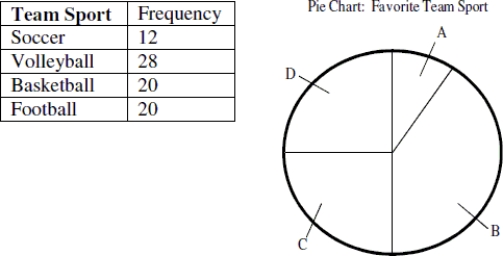
A) Area A
B) Area B
C) Area C
D) Area D
Correct Answer:

Verified
Correct Answer:
Verified
Related Questions
Q20: Did one group (males or females)show more
Q21: The distribution of heights of adult females
Q22: The distribution of the numbers of times
Q23: According to the histogram, about how many
Q24: The histogram below is the distribution of
Q26: Which group is more likely to spend
Q27: The histogram shows the distribution of pitch
Q28: The graph below displays the number of
Q29: The distribution of test scores for a
Q30: Define the important features to look for