Multiple Choice
The histogram below is the distribution of heights for a randomly selected Boy Scout troupe. Choose the statement that is true based on information from the histogram. 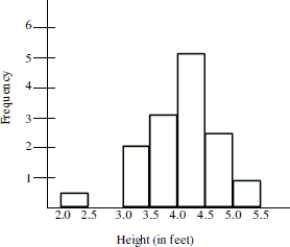
A) The smallest value is so extreme that it is possible that a mistake was made in recording the data.
B) The gap between the two smallest values indicates an outlier may be present.
C) Although the smallest value does not fit the pattern, it should not be altogether disregarded. It is possible that the Boy Scout is 2.4 feet tall.
D) All of these are true statements.
Correct Answer:

Verified
Correct Answer:
Verified
Q19: For twenty days a record store owner
Q20: Did one group (males or females)show more
Q21: The distribution of heights of adult females
Q22: The distribution of the numbers of times
Q23: According to the histogram, about how many
Q25: A group of junior high athletes was
Q26: Which group is more likely to spend
Q27: The histogram shows the distribution of pitch
Q28: The graph below displays the number of
Q29: The distribution of test scores for a