Multiple Choice
The graph below displays the number of homicides in the city of Flint, Michigan for each of the last three years. A reported interprets this graph to mean that the number of murders in 2010 was more than twice the number of murders in 2008. Is the reporter making a correct interpretation? 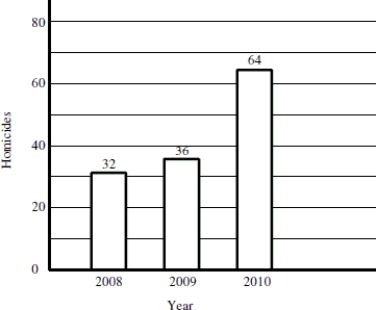
A) No. The width of the bars is identical, indicating that the number of murders in 2010 is no different from 2008.
B) There is not enough information given in the graph to determine whether the reporter's interpretation is correct or not.
C) Yes. The bar for 2010 is twice the height of the bar for 2008 and the number of murders indicated above the bars confirms that murders in 2010 were more than twice the level in 2008.
Correct Answer:

Verified
Correct Answer:
Verified
Q23: According to the histogram, about how many
Q24: The histogram below is the distribution of
Q25: A group of junior high athletes was
Q26: Which group is more likely to spend
Q27: The histogram shows the distribution of pitch
Q29: The distribution of test scores for a
Q30: Define the important features to look for
Q31: Each day for twenty days a record
Q32: About what percentage of households own no
Q33: Based on the histogram below, would it