Multiple Choice
Below is a graph of a function  .Over what region(s) is the function decreasing?
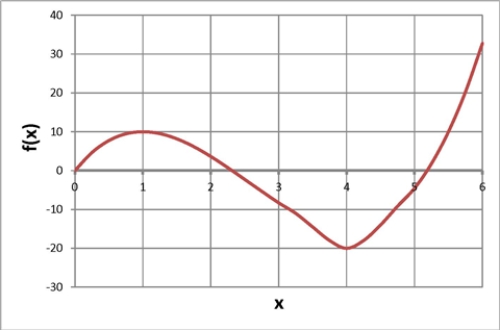
A) from 0 to 1 and from 4 to 6
B) from 1 to 4
C) from -20 to 10
D) None of the above
Correct Answer:

Verified
Correct Answer:
Verified
Related Questions
Q1: The graph below shows the growth rate
Q2: The graph below shows the maximum angle
Q3: The graph below shows the numbers, in
Q5: A decreasing graph is always concave down.
Q6: The graph below shows the maximum angle
Q7: The graph of a function that is
Q8: Which of the following stories best fits
Q9: The graph below shows the atmospheric pressure,
Q10: Below is a graph of a function
Q11: Below is a graph of a function