Multiple Choice
The graph below shows the maximum angle above the horizon reached by the moon during the month of June.What was the average rate of change in the maximum angle from June 8 to June 14? 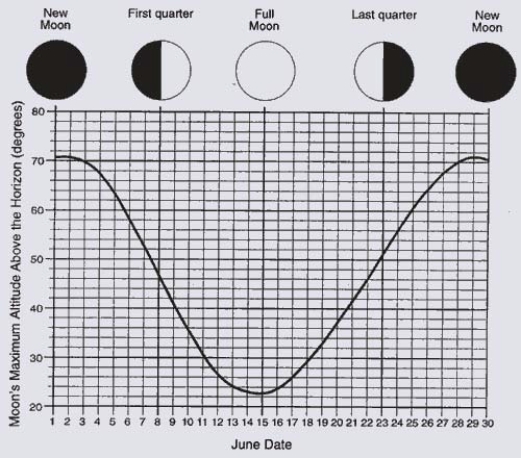
A) -3.43 degrees per day
B) -16 degrees per day
C) -7 degrees per day
D) None of the above.
Correct Answer:

Verified
Correct Answer:
Verified
Related Questions
Q1: The graph below shows the growth rate
Q2: The graph below shows the maximum angle
Q3: The graph below shows the numbers, in
Q4: Below is a graph of a function
Q5: A decreasing graph is always concave down.
Q7: The graph of a function that is
Q8: Which of the following stories best fits
Q9: The graph below shows the atmospheric pressure,
Q10: Below is a graph of a function
Q11: Below is a graph of a function