Multiple Choice
The graph below shows the growth rate G, in water fleas per day, of a population of water fleas as a function of the population size N.Calculate the average rate of change in G from 130 to 160 water fleas. 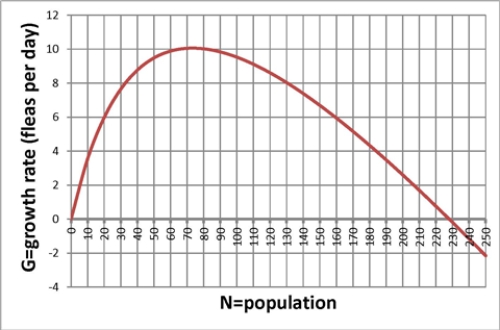
A) -0.07 water fleas per day per water flea.
B) 6 water fleas per day per water flea.
C) 30 water fleas per day per water flea.
D) None of the above.
Correct Answer:

Verified
Correct Answer:
Verified
Q2: The graph below shows the maximum angle
Q3: The graph below shows the numbers, in
Q4: Below is a graph of a function
Q5: A decreasing graph is always concave down.
Q6: The graph below shows the maximum angle
Q7: The graph of a function that is
Q8: Which of the following stories best fits
Q9: The graph below shows the atmospheric pressure,
Q10: Below is a graph of a function
Q11: Below is a graph of a function