Multiple Choice
The graph below shows the value, in dollars, of a foreign currency t years after 2000. For what two dates between 2000 and 2020 would earn you the most money if you bought the foreign currency on the first date and sold on the second?
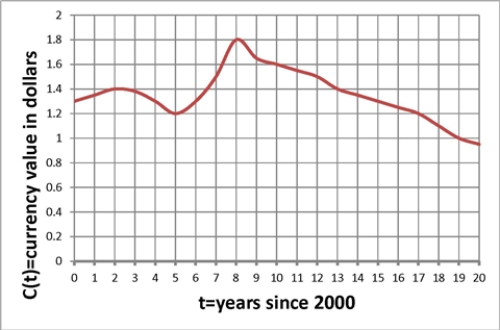
A) Buy in 2002 and sell in 2008
B) Buy in 2008 and sell the same year
C) Buy in 2005 and sell in 2008
D) None of the above
Correct Answer:

Verified
Correct Answer:
Verified
Q28: Below is a graph of a function
Q29: Which of the following stories best fits
Q30: Below is a graph of a function
Q31: Choose the answer that best completes the
Q32: Which of the following stories best fits
Q34: The graph below shows the fundraising of
Q35: The graph below shows the value, in
Q36: The graph below shows the numbers, in
Q37: The graph below shows the blood-glucose levels,
Q38: Below is a graph of a function