Multiple Choice
The graph below shows the blood-glucose levels, in milligrams per deciliter, as a function of hours since a meal was ingested.The three graphs are for a healthy person (labeled normal) , a prediabetic, and a diabetic person.The graph indicates that regardless of diabetic condition, blood-glucose reaches a maximum concentration about how many hours after eating?
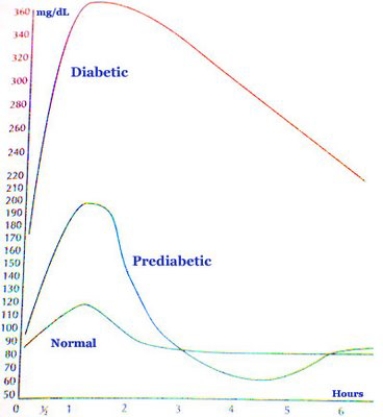
A) About 110 milligrams per deciliter
B) About 70 milligrams per deciliter
C) About 1 hour after eating
D) About 4.5 hours after eating
Correct Answer:

Verified
Correct Answer:
Verified
Q28: Below is a graph of a function
Q29: Which of the following stories best fits
Q30: Below is a graph of a function
Q31: Choose the answer that best completes the
Q32: Which of the following stories best fits
Q33: The graph below shows the value, in
Q34: The graph below shows the fundraising of
Q35: The graph below shows the value, in
Q36: The graph below shows the numbers, in
Q38: Below is a graph of a function