Multiple Choice
The graph below shows the value, in dollars, of a foreign currency t years after 2000. In what year from 2000 to 2020 did the value of the foreign currency reach its maximum, and what was that maximum value?
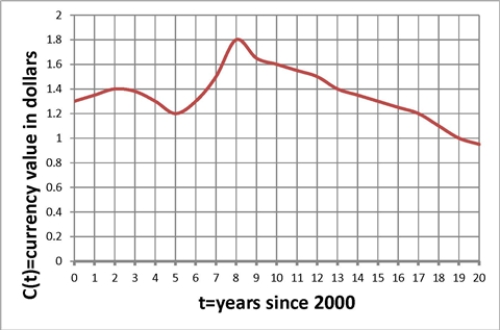
A) The maximum value of $1.80 occurred in 2008.
B) The maximum value of $1.20 occurred in 2005.
C) The maximum value of $1.40 occurred in 2002.
D) The maximum value of $0.90 occurred in 2020.
Correct Answer:

Verified
Correct Answer:
Verified
Q28: Below is a graph of a function
Q29: Which of the following stories best fits
Q30: Below is a graph of a function
Q31: Choose the answer that best completes the
Q32: Which of the following stories best fits
Q33: The graph below shows the value, in
Q34: The graph below shows the fundraising of
Q36: The graph below shows the numbers, in
Q37: The graph below shows the blood-glucose levels,
Q38: Below is a graph of a function