Multiple Choice
Use the following to answer questions
This histogram represents the distribution of the number of years of education completed by twins who attended the 16th Annual Twins Day Festival in Twinsburg, Ohio, in August of 1991.
Figure: Years of Education 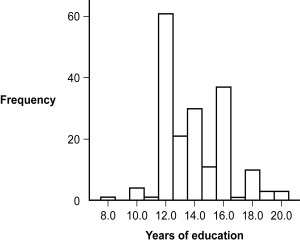
-(Figure: Years of Education) What seems to be the shape of this distribution?
A) negatively skewed
B) positively skewed
C) rectangle
D) symmetrical
Correct Answer:

Verified
Correct Answer:
Verified
Q57: A positive skew may have a tail
Q58: Bar graphs typically provide scores for _
Q59: Use the following to answer question <br>This
Q60: To calculate a percentage in a frequency
Q61: Use the following to answer questions <br>This
Q63: A teacher calculated her students' test scores
Q64: Normal distributions are symmetric and inherently have
Q65: Floor effects can lead to negative skew
Q66: When creating a grouped frequency table, most
Q67: In a frequency polygon, the x-axis represents