Multiple Choice
Use the following to answer question
This histogram represents the frequency of graduation rates for all U.S.colleges (data collected by U.S.News & World Report, 1995) .
Figure: Graduation Rates 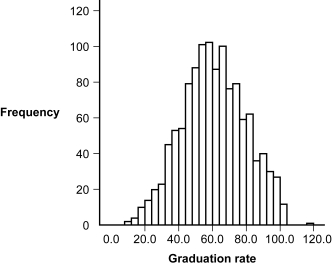
-(Figure: Graduation Rates) The shape of the distribution of graduation rates appears to be:
A) normal.
B) rectangular.
C) positively skewed.
D) negatively skewed.
Correct Answer:

Verified
Correct Answer:
Verified
Q54: A _ is a line graph with
Q55: A _ is a data point that
Q56: In a _, the tail of the
Q57: A positive skew may have a tail
Q58: Bar graphs typically provide scores for _
Q60: To calculate a percentage in a frequency
Q61: Use the following to answer questions <br>This
Q62: Use the following to answer questions <br>This
Q63: A teacher calculated her students' test scores
Q64: Normal distributions are symmetric and inherently have