Multiple Choice
Use the following to answer questions
This polygon represents a fictional distribution of scores.
Figure: Frequency Polygon 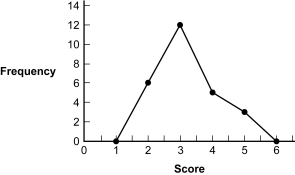
-(Figure: Frequency Polygon) Based on the frequency distribution, how many participants scored a 4 or above?
A) 4
B) 5
C) 8
D) 10
Correct Answer:

Verified
Correct Answer:
Verified
Related Questions
Q56: In a _, the tail of the
Q57: A positive skew may have a tail
Q58: Bar graphs typically provide scores for _
Q59: Use the following to answer question <br>This
Q60: To calculate a percentage in a frequency
Q62: Use the following to answer questions <br>This
Q63: A teacher calculated her students' test scores
Q64: Normal distributions are symmetric and inherently have
Q65: Floor effects can lead to negative skew
Q66: When creating a grouped frequency table, most