Multiple Choice
Use the graph to answer the following question.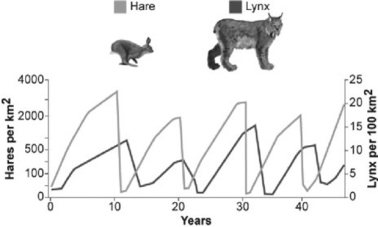
What conclusion can you draw from the figure?
A) Hares decrease in number just before lynx population size increases.
B) Lynx control hare population size.
C) Lynx and hare populations are independent of each other.
D) The relationship between the populations cannot be determined only from this graph.
Correct Answer:

Verified
Correct Answer:
Verified
Q48: During exponential growth, a population always _.<br>A)
Q59: Which of the following scenarios would provide
Q60: Use the survivorship curves in the figure
Q61: Use the graph to answer the following
Q62: Which of the following causes populations to
Q63: What is the primary limiting factor that
Q64: Use the graph to answer the following
Q65: You observe two breeding female fish of
Q66: A population of ground squirrels has an
Q69: Consider two old-growth forests: One is undisturbed