Multiple Choice
TABLE 15-9
Many factors determine the attendance at Major League Baseball games. These factors can include when the game is played, the weather, the opponent, whether or not the team is having a good season, and whether or not a marketing promotion is held. Data from 80 games of the Kansas City Royals for the following variables are collected.
ATTENDANCE = Paid attendance for the game
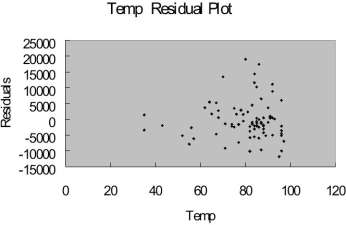
TEMP = High temperature for the day
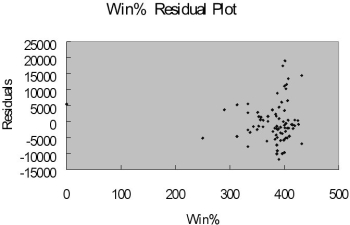
WIN% = Team's winning percentage at the time of the game
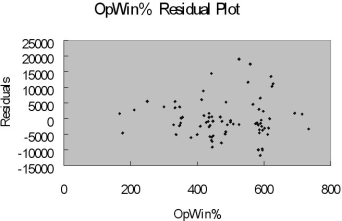
OPWIN% = Opponent team's winning percentage at the time of the game WEEKEND - 1 if game played on Friday, Saturday or Sunday; 0 otherwise PROMOTION - 1 = if a promotion was held; 0 = if no promotion was held
The regression results using attendance as the dependent variable and the remaining five variables as the independent variables are presented below.
The coefficient of multiple determination ( R 2 j ) of each of the 5 predictors with all the other remaining predictors are, respectively, 0.2675, 0.3101, 0.1038, 0.7325, and 0.7308
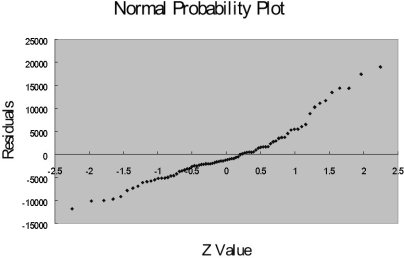
-Referring to Table 15-9, which of the following assumptions is most likely violated based on the normal probability plot?
A) equal variance
B) normality of errors
C) linearity
D) none of the above
Correct Answer:

Verified
Correct Answer:
Verified
Q3: TABLE 15-7<br>A chemist employed by a
Q4: TABLE 15-3<br>A certain type of rare
Q6: TABLE 15-9<br>Many factors determine the attendance
Q7: TABLE 15-7<br>A chemist employed by a
Q11: TABLE 15-4<br>In Hawaii, condemnation proceedings are
Q12: Using the Studentized residuals ti to
Q13: A regression diagnostic tool used to study
Q13: TABLE 15- 8<br>The superintendent of a
Q52: Collinearity is present when there is a
Q63: Collinearity will result in excessively low standard