Multiple Choice
A CFO is looking at how much the company is spending on computing.He samples companies in the pharmaceutical industry and develops the following stem-and-leaf graph. 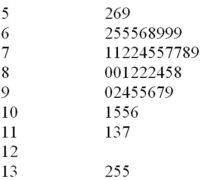 If you were creating a frequency histogram using these data,how many classes would you create?
A) 4
B) 5
C) 6
D) 7
E) 8
Correct Answer:

Verified
Correct Answer:
Verified
Related Questions
Q4: A CFO is looking at how much
Q5: The following is a relative frequency distribution
Q8: Consider the following data on distances traveled
Q9: The US local airport keeps track of
Q10: A scatter plot can be used to
Q10: The number of weekly sales calls by
Q14: If there are 62 values in a
Q45: Consider the following data on distances traveled
Q64: All of the following are used to
Q94: The following is a relative frequency distribution