Essay
Economists believe that historically, countries with more income inequality have had lower unemployment rates. For example, an economist in 1996 developed the table below containing the following information for 10 countries during the 1980-1995 time period:
· The change from 1980 to 1995 in ratio of the average wage of the top 10% of all wage earners to the median wage
· The change from 1980 to 1995 in unemployment rate.
Income inequality vs. Unemployment rate 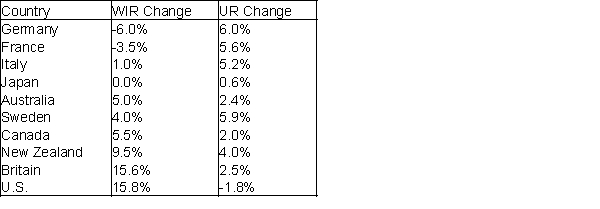
-Explain why the ratio of the average wage of the top 10% of all wage earners to the median measures income inequality.
Correct Answer:

Verified
If this ratio is high, then a relatively...View Answer
Unlock this answer now
Get Access to more Verified Answers free of charge
Correct Answer:
Verified
View Answer
Unlock this answer now
Get Access to more Verified Answers free of charge
Q7: Statisticians often refer to the pivot tables
Q19: The four areas of a pivot table
Q33: If the coefficient of correlation r =
Q49: One characteristic of "paired variables" is that<br>A)one
Q55: Approximate the percentage of these Internet users
Q76: If the sample is a good representation
Q76: The following scatterplot compares the selling price
Q78: We study relationships among numerical variables using:<br>A)
Q179: What percentage of the students in the
Q203: THE NEXT QUESTIONS ARE BASED ON THE