Essay
Based on the histogram shown below, how would you describe the age distribution for these data? 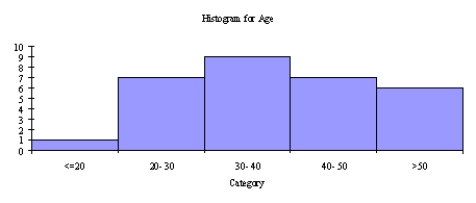
Correct Answer:

Verified
The age distribution is skewed slightly ...View Answer
Unlock this answer now
Get Access to more Verified Answers free of charge
Correct Answer:
Verified
The age distribution is skewed slightly ...
View Answer
Unlock this answer now
Get Access to more Verified Answers free of charge
Related Questions
Q4: The median of a data set with
Q23: As a graphical tool,the histogram is ideal
Q30: Data can be categorized as cross-sectional or
Q32: Age,height,and weight are examples of numerical data.
Q90: The length of the box in the
Q91: What measure of distribution relates to extreme
Q94: A think tank of economists is interested
Q96: A variable is classified as ordinal if:<br>A)
Q97: Excel<sup>®</sup> stores dates as:<br>A) numbers<br>B) variables<br>C) records<br>D)
Q99: In order for the characteristics of a