Essay
The following data show the quarterly sales of Amazing Graphics, Inc. for the years 6 through 8. 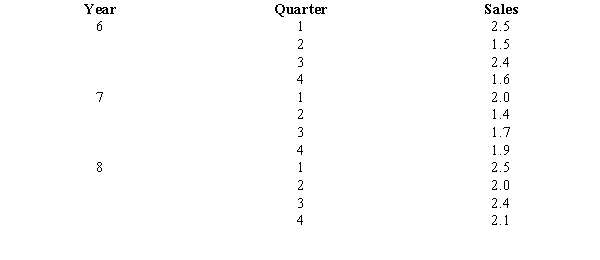
a.Compute the four-quarter moving average values for the above time series.
b.Compute the seasonal factors for the four quarters.
c.Use the seasonal factors developed in Part b to adjust the forecast for the effect of season for year 6.
Correct Answer:

Verified
a.Centered Moving Averages: 1....View Answer
Unlock this answer now
Get Access to more Verified Answers free of charge
Correct Answer:
Verified
View Answer
Unlock this answer now
Get Access to more Verified Answers free of charge
Q37: A method of smoothing a time series
Q58: A group of observations measured at successive
Q59: The quarterly sales of a company (in
Q60: What is the forecast for July based
Q61: One measure of the accuracy of a
Q62: A parameter of the exponential smoothing model
Q63: Exhibit 18-3<br>Consider the following time series. <img
Q64: The following time series shows the
Q65: Below you are given the first two
Q66: The following linear trend expression was estimated