Multiple Choice
The graph of the profit function 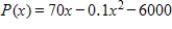 is given as follows. Consider the average rate of change of the profit from a to 350 where a lies to the left of 350. Does the average rate of change of the profit get closer to 0 or farther from 0 as a gets closer to 350?
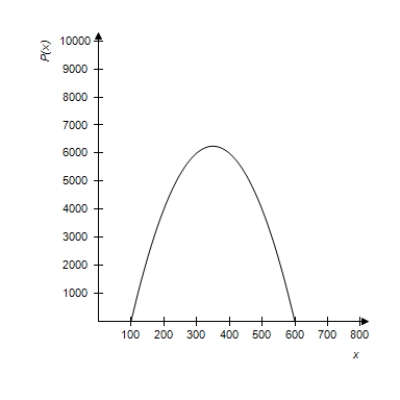
A) closer to 0
B) farther from 0
Correct Answer:

Verified
Correct Answer:
Verified
Q2: Find the maximum revenue for the revenue
Q3: Suppose that the following table gives the
Q4: Determine whether the vertex of the graph
Q5: Sketch the graph of the function <img
Q6: A fissure in the earth appeared after
Q7: Determine if the vertex of the graph
Q8: The table below shows the national expenditures
Q9: Determine whether the given graph is the
Q10: The table shows the average earnings of
Q11: By recognizing shapes and features of polynomial