Multiple Choice
The chart shows the number of research articles in the prominent journal Physics Review that were written by researchers in Europe during 1983 - 2003 ( represents 1983) . 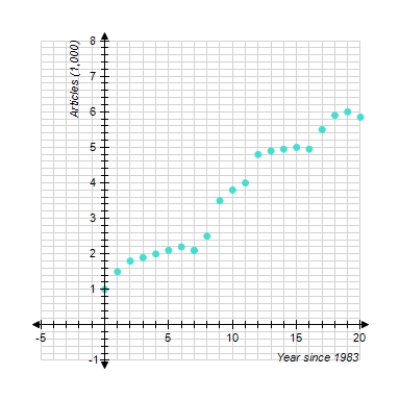
Which of the following logistic functions best models the data (t is the number of years since 1983.) Try to determine the correct model without actually computing data points.
A)
B)
C)
D)
E)
Correct Answer:

Verified
Correct Answer:
Verified
Q30: The given table corresponds to the
Q31: The amount of carbon-14 remaining in
Q32: Model the data using an exponential
Q33: Find an equation for an exponential
Q34: Find the logistic function f with
Q36: The graph shows the actual percentage
Q37: Use technology to find a logistic
Q38: Model the data using an exponential
Q39: The following graph shows the actual
Q40: Use logarithms to solve the equation.