Short Answer
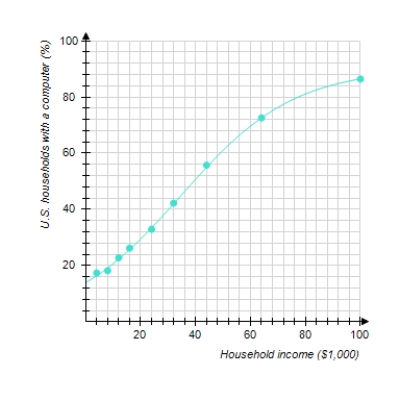
The graph shows the actual percentage of U.S. households with a computer as a function of household income (the data points) and a logistic model of these data (the curve). The logistic model is
where x is the household income in thousands of dollars. According to the model, what percentage of extremely wealthy households had computers
P = __________%
Correct Answer:

Verified
Correct Answer:
Verified
Q31: The amount of carbon-14 remaining in
Q32: Model the data using an exponential
Q33: Find an equation for an exponential
Q34: Find the logistic function f with
Q35: The chart shows the number of
Q37: Use technology to find a logistic
Q38: Model the data using an exponential
Q39: The following graph shows the actual
Q40: Use logarithms to solve the equation.
Q41: Find the logistic function f with