Multiple Choice
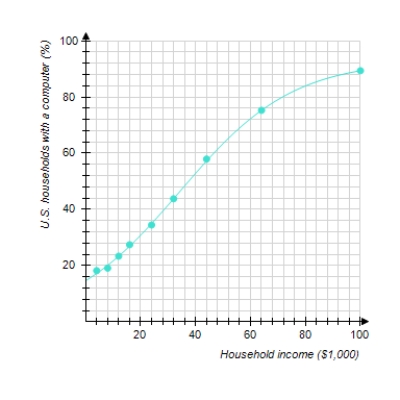
The following graph shows the actual percentage of U.S. households with a computer as a function of household income (the data points) and a logistic model of these data (the curve) . The logistic model is
Where x is the household income in thousands of dollars. For low incomes, the logistic model is approximately exponential. Which exponential model best approximates P(x) for small x Round the coefficients to the nearest hundredth.
A)
B)
C)
D)
E)
Correct Answer:

Verified
Correct Answer:
Verified
Q34: Find the logistic function f with
Q35: The chart shows the number of
Q36: The graph shows the actual percentage
Q37: Use technology to find a logistic
Q38: Model the data using an exponential
Q40: Use logarithms to solve the equation.
Q41: Find the logistic function f with
Q42: Choose the logistic function that best
Q43: The fuel efficiency (in miles per
Q44: The given table corresponds to the